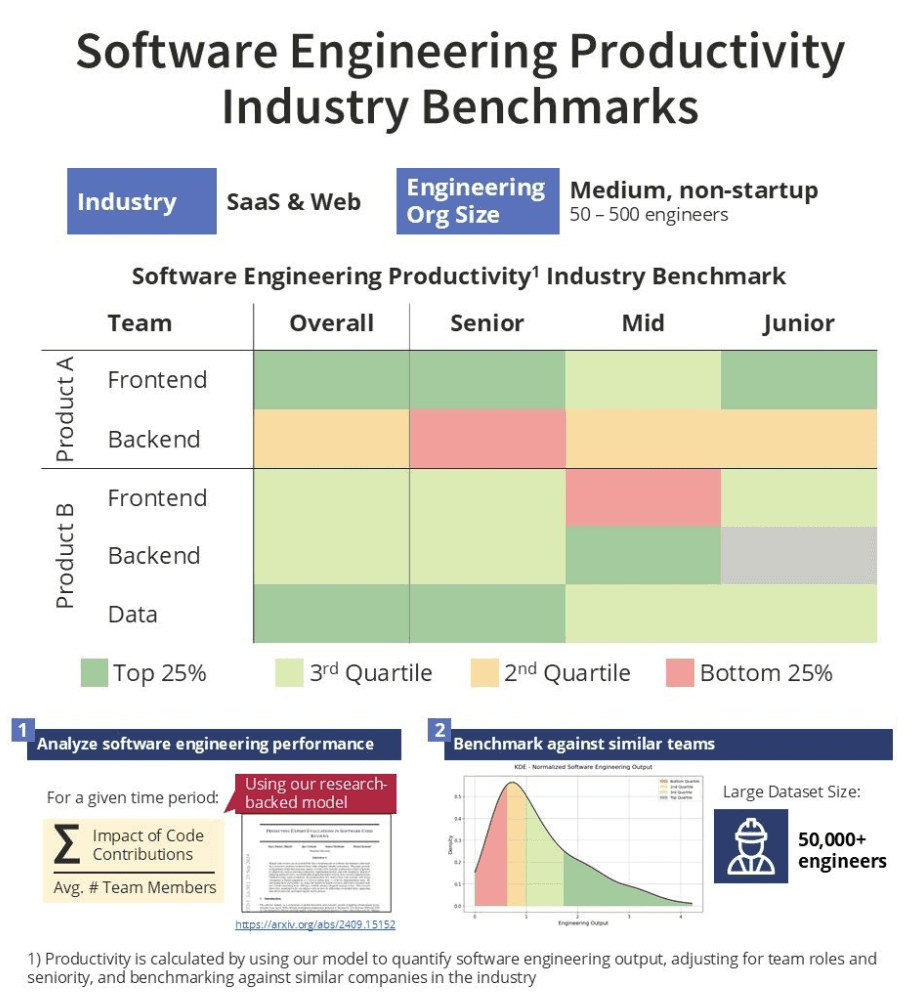
Objective Productivity Data for Smarter Engineering Team Decisions
Objective Productivity Data for Smarter Engineering Team Decisions
Objective Productivity Data for Smarter Engineering Team Decisions
Our model analyzes the content of code contributions, delivering a more precise and meaningful measure of engineering output.
Our model analyzes the content of code contributions, delivering a more precise and meaningful measure of engineering output.
Our model analyzes the content of code contributions, delivering a more precise and meaningful measure of engineering output.
Use our data to make decisions like:
Optimize Team Size
M&A Technical Due Diligence
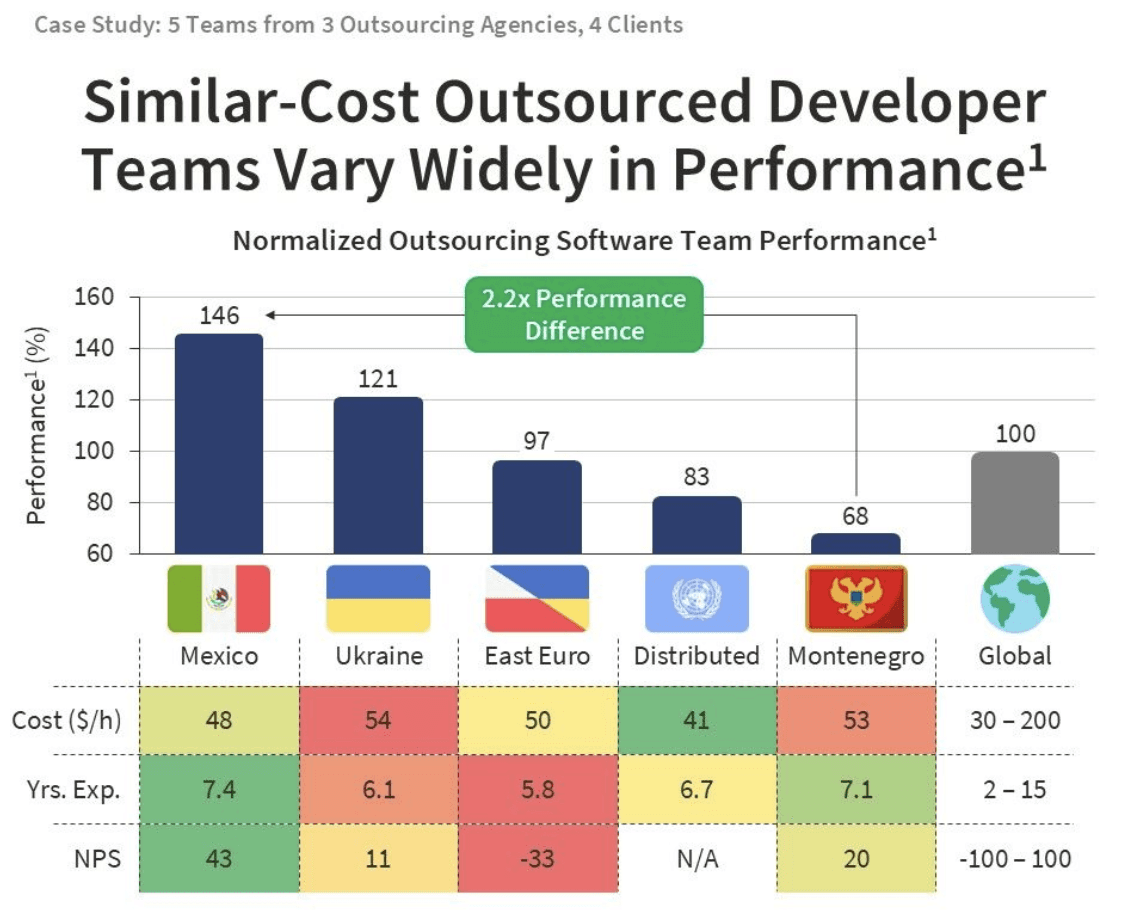
Select Outsourcing Partners
Manage Team Performance
Internal & External Benchmarking
Advanced Analytics
Analyze Tool ROI
Remote, Hybrid, or Office Work
Refactoring Decisions
Optimize Team Size

Why Us?
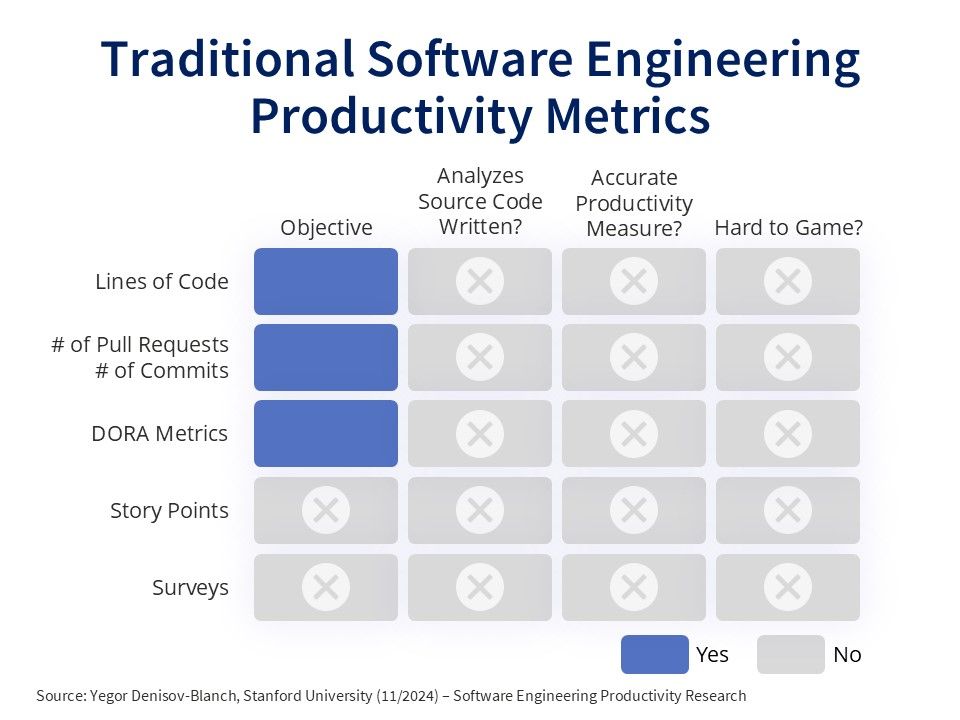
The only solution that analyzes source code to measure engineering output
Engineering productivity is driven by source code contributions. Our research-backed model measures output by evaluating the impact of code changes.
Why Us?
The only solution that analyzes source code to measure engineering output
Engineering productivity is driven by source code contributions. Our research-backed model measures output by evaluating the impact of code changes.
Why Us?
The only solution that analyzes source code to measure engineering output
Engineering productivity is driven by source code contributions. Our research-backed model measures output by evaluating the impact of code changes.


Based on Stanford Research
Gain a comprehensive understanding of your visitors' behavior with advanced analytics powered by AI.


Support of popular Git providers
Our dedicated support team is available around the clock to ensure you never face challenges alone.


P10Y setup


P10Y setup


Easy setup in under 30 minutes
Get productivity insights in a few easy steps. No tech skills needed — anyone can get involved.


Cloud & On-Prem Versions
Choose between cloud or on-prem deployment (for heightened security needs)


Real-Time & Historical Insights
Gain deep insights into visitor behavior. From traffic sources to engagement
Languages & Frameworks
18 Supported Programming Languages & Frameworks
18 Supported Programming Languages & Frameworks
18 Supported Programming Languages & Frameworks
Our tool is optimized for the leading languages and frameworks.
Our tool is optimized for the leading languages and frameworks.
Our tool is optimized for the leading languages and frameworks.











Pricing
Affordable, flexible and transparent plans for your needs
Starter
For individuals or small research teams
Free
Free
Free
You will get:
Access to basic analytics dashboard
Analysis of 6 months of data, older than 6 months
Help Docs
Cloud
For scaling companies
Perfect for scaling companies
$50
$50
/seat /month
Includes all features of the Free Plan, plus:
Real time coverage
1 year of historic data backfill
Access to data older than 1 year (paid add-on)
API Access (paid add-on)
Priority Support
Cloud
For scaling companies
$50
$50
/seat /month
Includes all features of the Free Plan, plus:
Real time coverage
1 year of historic data backfill
Access to data older than 1 year (paid add-on)
API Access (paid add-on)
Priority Support
Enterprise
For big corporates
Contact us
Contact us
Contact us
Includes all features of the Free Plan, plus:
Real time coverage
2 years of historic data backfill
Access to data older than 2 years (paid add-on)
API Access (paid add-on)
On Premise Installation
Dedicated Support


Join our exclusive research trial &
explore the tech — free for testers.
Connect your data and contribute to the research behind
our technology.
Join our exclusive research trial &
explore the tech — free for testers.
Connect your data and contribute to the research behind
our technology.
Join our exclusive research trial &
explore the tech — free for testers.
Connect your data and contribute to the research behind
our technology.


Our Blog
Insights & Updates: Explore Our Latest Insights
Dive into our blog for expert insights, tips, and industry trends.
Our Blog
Insights & Updates: Explore Our Latest Insights
Dive into our blog for expert insights, tips, and industry trends.
Our Blog
Insights & Updates: Explore Our Latest Insights
Dive into our blog for expert insights, tips, and industry trends.
FAQ’s
Your questions answered
How is your solution different?
How exactly do you calculate your metric (output units)?
Do you need access to source code?
What can I use the data you generate for?
FAQ’s
Your questions answered
How is your solution different?
How exactly do you calculate your metric (output units)?
Do you need access to source code?
What can I use the data you generate for?
FAQ’s
Your questions answered
How is your solution different?
How exactly do you calculate your metric (output units)?
Do you need access to source code?
What can I use the data you generate for?
Contact Us
Get in Touch with Us
Get in touch for questions, support, or partnership opportunities. We’re here to help!
Send Us a Message
Contact Us
Get in Touch with Us
Get in touch for questions, support, or partnership opportunities. We’re here to help!
Send Us a Message
Contact Us
Get in Touch with Us
Get in touch for questions, support, or partnership opportunities. We’re here to help!
Send Us a Message
Let's talk
Let's talk
Let's talk

